These methods are frequently used in geological engineering to study the response of the ground when continuous electric currents (DC) are passed through it. The physical parameter tested is resistivity (ρ), and a final interpretation is made based on the geological characteristics of the test area. Resistivity is an intrinsic property of rocks and soils that depends on lithology, microstructure and, above all, water content; it is therefore not an isotropic property of the ground but a function of the direction in which it is measured. Table 1 shows some resistivity values in soils and rocks.
| Materials | Resistivity ρ (om/m) |
| Marls | 50–5,000 |
| Limestones | 300–10,000 |
| Shales | 100–1,000 |
| Granites | 300–10,000 |
| Clays | 1–20 |
| Sands | 50–500 |
| Conglomerates | 1,000–10,000 |
| Sandstones | 50–5,000 |
| Alluvium | 50–800 |
2-D Electrical imaging surveys
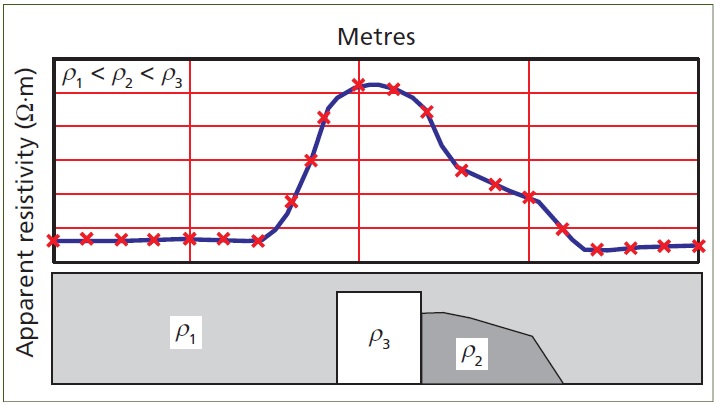
With 2-D Electrical imaging surveys technique, the entire set-up (A, B, M and N) is moved laterally. A current is applied in each position and the difference in potential generated is measured. This is carried out using any of the electrodic arrays already referred to: Schlumberger, Wenner, dipole-dipole, or one of the many variants. The resistivity obtained in each case is apparent resistivity ρa, and variations observed are lateral because of the type of displacement (Figure 1).
Pseudosections
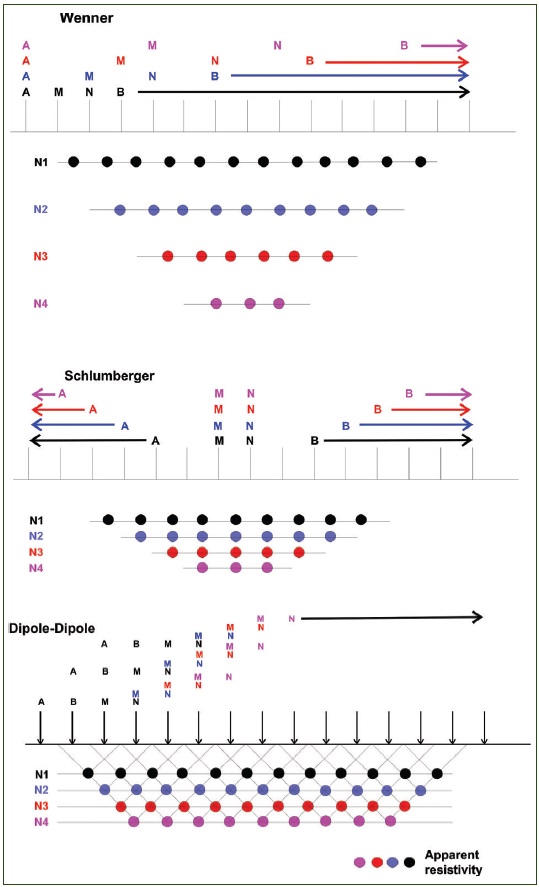
When sounding at different depths and levels are made simultaneously with any electrode device (Figure 2) the distribution of ρa can be represented on a cross section called a pseudo-section.
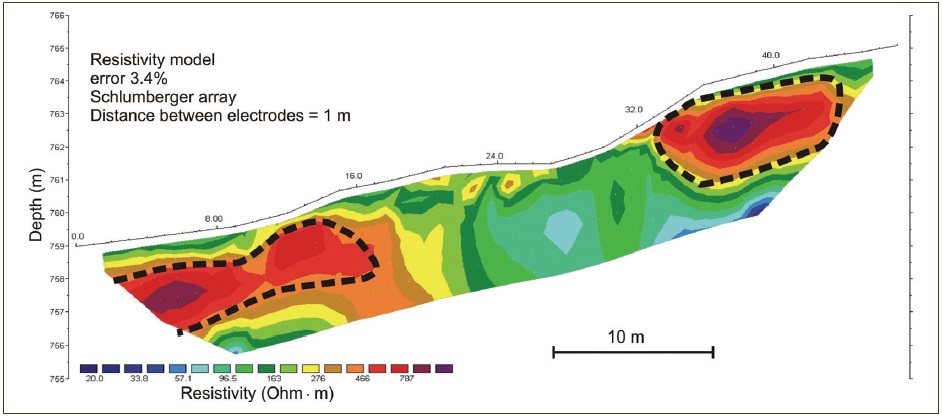
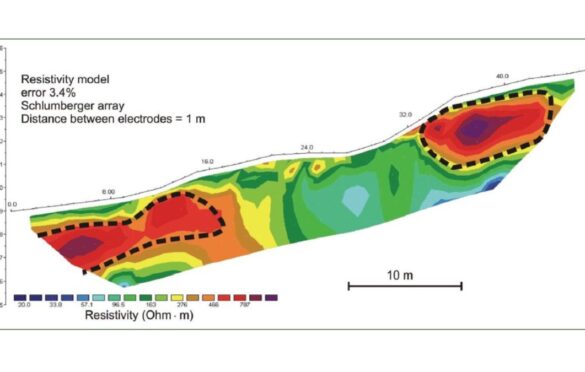
Electrical tomography
This is a model of the distribution of real resistivities in the subsoil obtained by an inversion process from the apparent resistivities detected in the pseudo-sections. The complexity of the inversion process depends on the methods used: e.g. finite differences, finite elements, the application of distorted grids to correct topography, or others.