Introduction
In the field of geology and cartography, topographic profiles play a crucial role in visualizing the elevation changes across a specific line on a landscape. These profiles provide valuable insights into the terrain’s features, such as hills, valleys, and streams. One of the essential concepts associated with topographic profiles is vertical exaggeration, which helps depict the elevation differences more prominently. In this article, we will guide you through the step-by-step process of constructing a topographic profile and understanding the concept of vertical exaggeration.
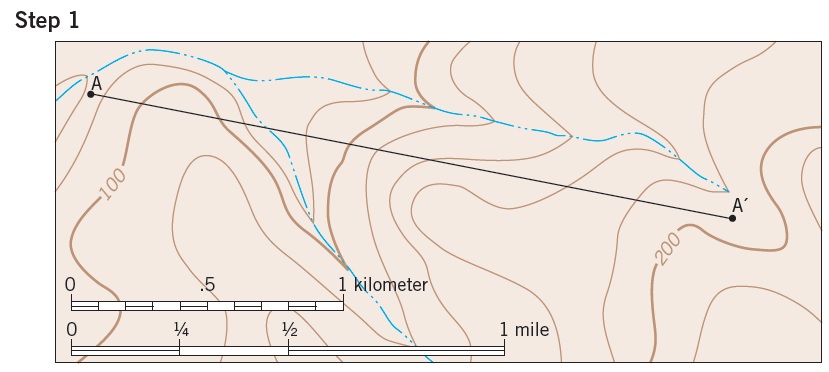
Step 1: Selecting Key Points
The first step in constructing a topographic profile involves selecting two key points, labeled as A and A’, along the line that connects them (line A–A’). This line will serve as the basis for our profile construction.
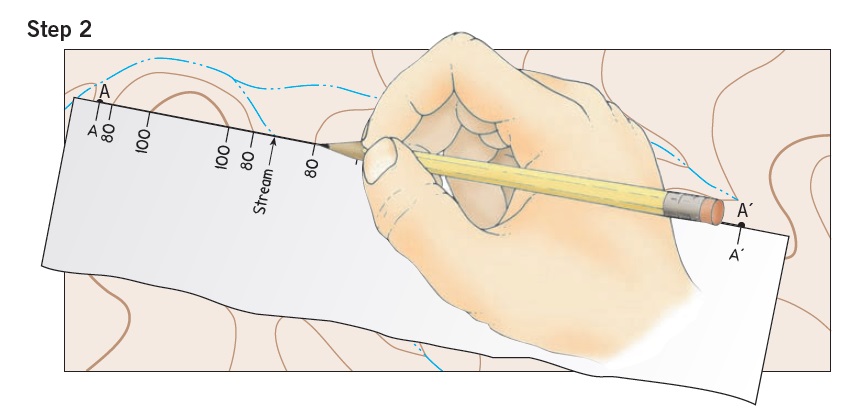
Step 2: Placing the Paper Strip on the Topographic Map
To begin constructing the topographic profile, take a strip of paper and align its edge along line A-A’ on the topographic map. At each intersection point between a contour line and a stream, place a tick mark on the paper’s edge. Simultaneously, record the elevation value corresponding to each contour line next to its respective tick mark.
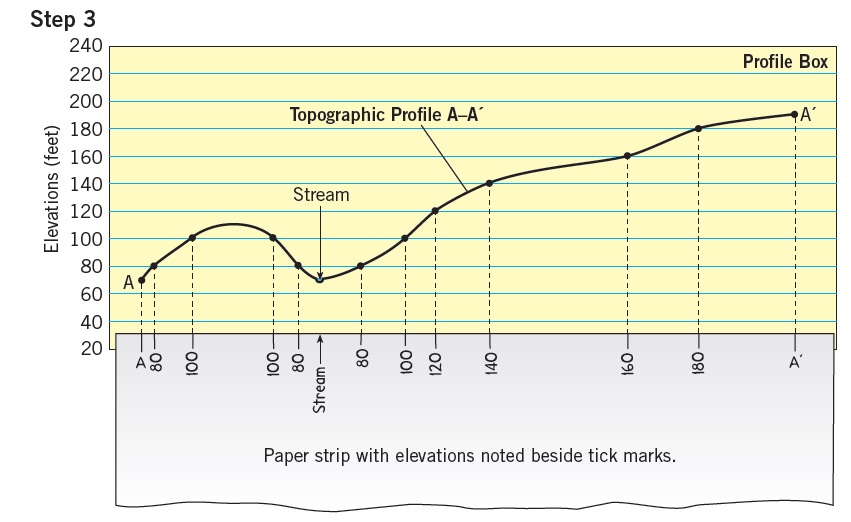
Step 3: Transferring Data to Lined Paper
The edge of the strip of paper (with tick marks and elevations) was placed along the bottom line of a piece of lined paper, and the lined paper was graduated for elevations (along its right margin). A black dot was placed on the profile above each tick mark at the elevation noted on the tick mark. The black dots were then connected with a smooth line to complete the topographic profile.
Step 4: Understanding Vertical Exaggeration
Vertical exaggeration is a critical concept when it comes to accurately representing elevation differences on a topographic profile. It involves comparing the vertical scale (elevation) to the horizontal scale (distance along the profile). The vertical exaggeration factor determines how much the vertical scale is stretched or compressed compared to the horizontal scale.
The formula for calculating vertical exaggeration (VE) is as follows:
Vertical Exaggeration (VE) = Vertical Scale / Horizontal Scale
A high vertical exaggeration value results in a more pronounced depiction of elevation changes, while a lower value yields a more subdued representation. It’s important to choose an appropriate vertical exaggeration based on the characteristics of the landscape you are representing.
Benefits of Constructing Topographic Profiles
Topographic profiles offer a range of benefits for various applications:
Geological Surveys: Geologists use topographic profiles to study rock layers, faults, and other geological features, aiding in the understanding of the Earth’s subsurface.
Civil Engineering: Engineers use topographic profiles to plan construction projects, assess potential sites, and design infrastructure that accounts for elevation changes.
Environmental Analysis: Environmentalists can analyze topographic profiles to assess the impact of natural processes, such as erosion and sediment transport.
Resource Management: Topographic profiles assist in managing land resources, including identifying suitable areas for agriculture, forestry, and conservation.
Conclusion
Constructing topographic profiles and understanding vertical exaggeration are fundamental skills in geology, cartography, and related fields. By following the steps outlined in this article, you can accurately create topographic profiles that provide valuable insights into the landscape’s elevation changes. Remember that vertical exaggeration enhances the visual representation of these changes, allowing you to effectively communicate and analyze the terrain’s characteristics. Whether you’re a geology enthusiast, a cartography professional, or an engineer, mastering these techniques will undoubtedly enrich your understanding of the Earth’s dynamic topography.