Atterberg limits
Atterberg limits are water contents at which marked changes occur in the engineering behavior of fine-grained soils. Finegrained soils, consisting of particles smaller than 0.074 mm (#200 sieve), include silt and clay. Water content is the ratio of the weight of water to the weight of solids in a soil mass, expressed as a percentage.
Atterberg limits were developed by Albert Atterberg, a Swedish soil scientist (1911). Based on the behavior of fine-grained soils with changing water content, Atterberg defined seven limits (Holtz et al. 2011). Casagrande (1932) standardized Atterberg limits for engineering classification of fine grained soils. The Atterberg limits used in engineering practice include liquid limit (LL), plastic limit (PL), and, less frequently, shrinkage limit (SL). Liquid limit is the lowest water content at which a soil-water mixture behaves as a viscous liquid, plastic limit is the lowest water content at which a soil-water mixture behaves as a plastic material, and shrinkage limit is the lowest water content beyond which no further change in volume occurs as the soil-water mixture dries. Plasticity index (PI) is the numerical difference between liquid limit and plastic limit. PI indicates the range of water contents over which a soil behaves as a plastic material.

On a continuum of soil-water mixture (Fig. 1), as the water content increases, the soil behavior changes from a brittle solid to a semi-solid, to a plastic solid, to a viscous liquid, and finally to a true liquid (Holtz et al. 2011). Although
Atterberg limits are water contents marking the boundaries between varying engineering behaviors of fine-grained soils, Atterberg limits, by convention, are reported without the percentage sign (Casagrande 1948) (Fig. 1).
Atterberg limits are very important index properties of fine-grained soils. They are used for classification of finegrained soils (Casagrande 1948) and have been correlated empirically with many other engineering properties of soils such as clay mineralogy (Mitchell and Soga 2005), shrinkswell behavior (Gibbs 1969; Mitchell and Gardner 1975; Martin-Nieto 2007), compression index (Terzaghi and Peck 1967), and shear strength parameters (Holtz et al. 2011). Both Atterberg limits and other engineering properties of finegrained soils are strongly influenced by the amount and types of clay minerals present in a soil. Higher values of LL and PI indicate that the soil has: (i) a high percentage of clay and active clay minerals (clay minerals that are sensitive to moisture changes), (ii) has a high resiliency, making it difficult to compact, (iii) has a low loadcarrying (bearing) capacity, and (iv) is more susceptible to volume changes upon moisture fluctuations, making it an undesirable foundation material.
Determining Atterberg Limits
Liquid Limit
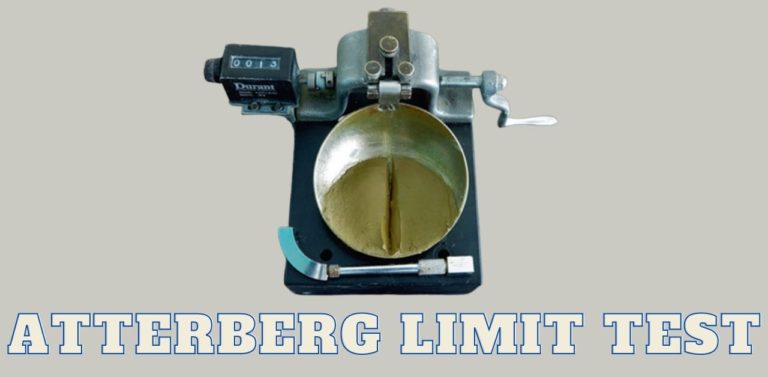
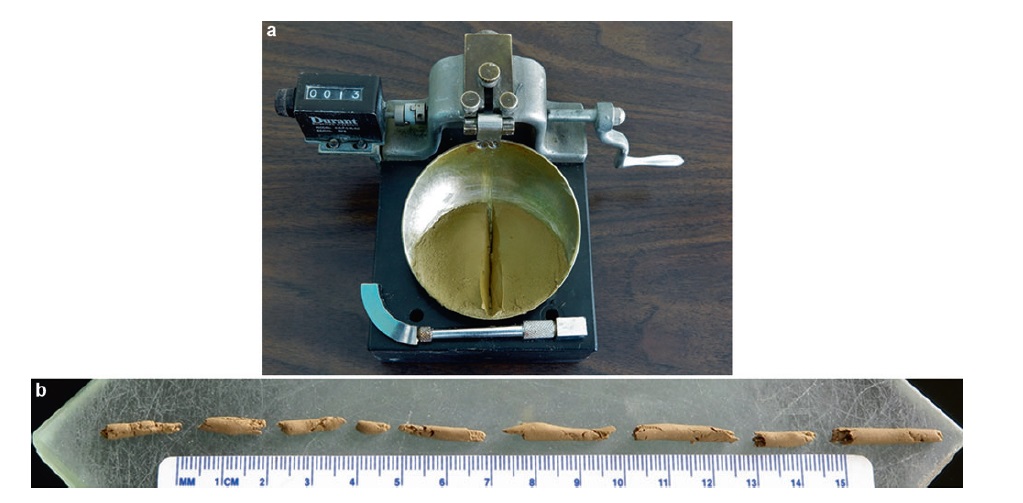
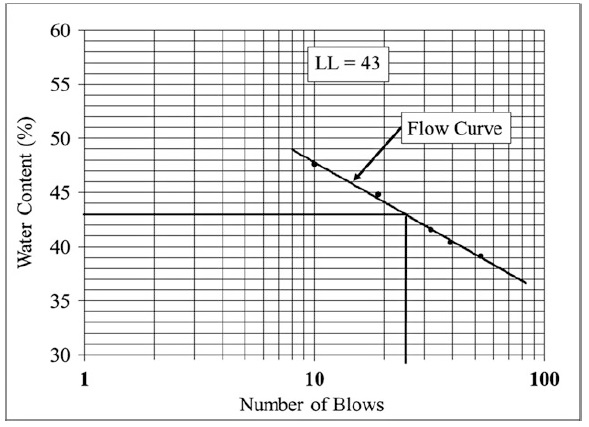
In order to standardize the test procedure for Atterberg limits, Casagrande (1932) defined liquid limit as the water content at which a groove cut in a soil pat, by a standard grooving tool, will require 25 blows to close for 13 mm when the LL-apparatus cup drops 10 mm on a hard rubber base (Fig. 2). The standardized test requires testing five to six samples so that approximately half require fewer than 25 blows to close the groove for 13 mm and half need more than 25 blows and plotting water contents (determined by oven-drying the tested samples for 24 h at 105 °C) versus logarithm of the corresponding number of blows (Fig. 3).
Where the resulting curve, known as the flow curve, crosses 25 blows, the corresponding water content defines the liquid limit. Details of liquid limit apparatus, grooving tool specifications, sample preparation, and test procedure can be found in American Society for Testing and Materials (ASTM) method D 4318 (ASTM 2010). The liquid limit values can range from zero to 1000, with most soils having LL values less than 100 (Holtz et al. 2011) (Figs. 2 and 3).
Plastic Limit
Plastic limit is the water content at which a thread of soil, rolled gently on a frosted glass plate to 3 mm diameter, crumbles into segments 3mm 10mmlong (Fig. 2). If the thread can be rolled to a diameter smaller than 3 mm, the soil water content is more than the PL and it should be balled up and rolled again. If the thread starts crumbling before it is 3 mm in diameter, the soil is drier than the PL and the procedure should be repeated after adding more water to it. Since the PL test is somewhat arbitrary, at least three trials are performed and the average value is reported. ASTM method D 4318 (ASTM 2010) provides details of the test procedure for the PL test. The PL can range from zero to 100, with most soils having values less than 40 (Holtz et al. 2011). Both the liquid limit and plastic limit tests are performed on material passing # 40 sieve (<0.425 mm).
Plasticity Index
Plasticity index (PI) is the numerical difference between LL and PL. It is one of the most important index properties of fine-grained soils.
Liquidity Index
Liquidity index (LI) compares the natural water content of a fine-grained soil with its Atterberg limits and helps predict if the natural soil will behave as a brittle solid, plastic material, or viscous liquid when disturbed. Liquidity index is defined as:

where wn is the natural water content of the soil. If LI is greater than 1, the soil will behave as a viscous liquid when disturbed; if LI is between 0 and 1, the soil will behave plastically, that is, deform without fracturing under the application of stresses; and if LI is less than zero (has a negative value), the soil will behave as a brittle material when stressed (Holtz et al. 2011).
Atterberg limits are water contents at which significant changes occur in the engineering behavior of silt and clay.
Important Atterberg limits include liquid limit, plastic limit, and plasticity index. Atterberg limits are used for classification of fine-grained soils and show significant correlations with many other properties of such soils. A comparison of Atterberg limits of a fine-grained soil with its natural water content, referred to as the liquidity index, indicates whether the soil would behave as a brittle material, as a plastic material, or as viscous liquid, when sheared.