Systematic discontinuities occur in sets with more or less similar orientation and characteristics. The relative orientation and spacing between different sets in a rock mass define the shape and size of the blocks making up the rock mass.
An unfavourable orientation of engineering works with respect to the orientation of discontinuity planes may permit instability to develop within a rock mass and can induce failure of engineered structures and facilities.
Orientation of a discontinuity in space is defined by its dip direction (direction of the line of maximum gradient of the discontinuity with respect to north) and dip (gradient of that line with respect to the horizontal). Measurements are carried out with a geological compass or a Clar-type compass.
Dip direction is measured clockwise from north and varies between 0º and 360º. Dip is measured with the clinometer, with values ranging from 0º (horizontal plane) to 90º (vertical plane). The values of dip direction and dip are usually recorded in this order on data sheets, with an indication of the type of discontinuity they correspond to. For example, a value of S0 270º/60º indicates a bedding plane with a 60º dip and a dip direction of 270º.
The orientation of a discontinuity plane can also be defined from its strike (the angle formed between a horizontal line drawn on the discontinuity plane and magnetic north) and its dip; dip direction (north, south, east or west) should also be indicated. The strike of the plane and dip direction form an angle of 90º (Figure 1).
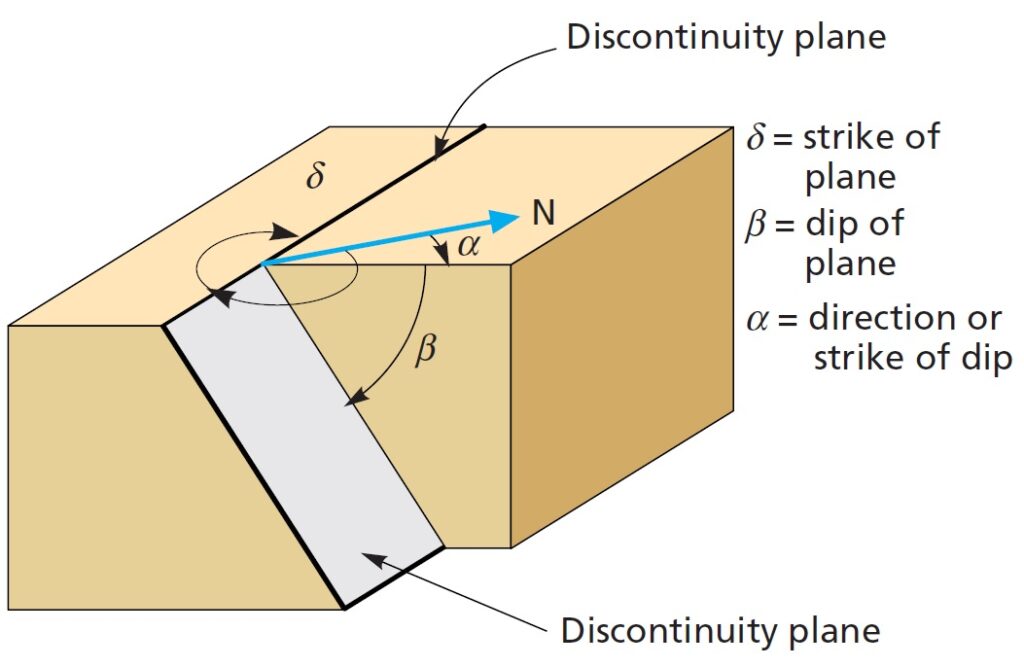
For example: J2 135º/50º SW indicates a discontinuity plane belonging to a set of joints J2 striking 135º with respect to north and towards the east, with a dip of 50º towards the south-west; the orientation of this plane can also be defined by 315º/50º SW. In order to define each set adequately it is recommended that a sufficient number of discontinuity orientations are measured.
The number of measurements will depend on the size of the area under study, the random distribution of orientations of the planes and the detail of the analysis. If orientations are constant, or there is little dispersion, fewer measurements will be required.
Graphic representation of the orientation of different discontinuity sets can be carried out by:
— Stereographical projection, representing the poles or planes with average values of different sets.
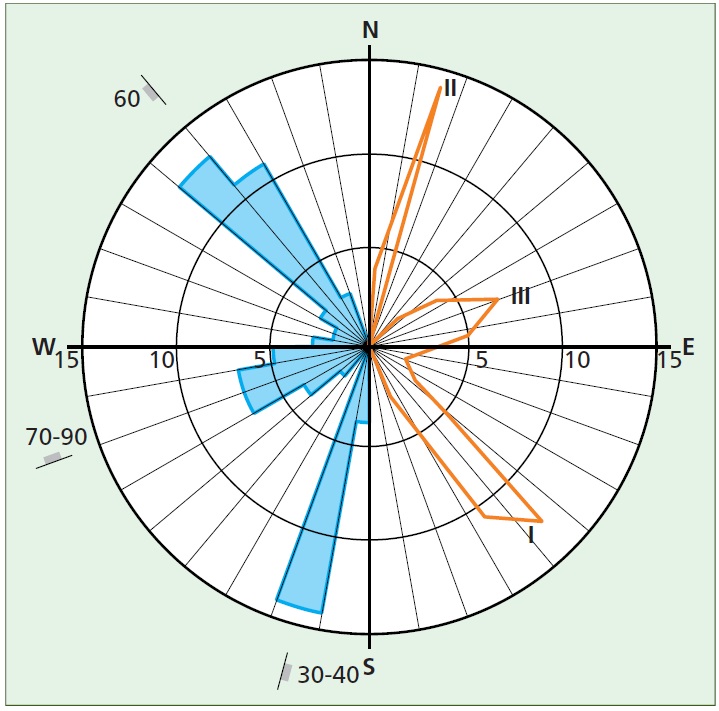
— Rosette diagrams, which enable a large number of numerical measurements of orientations to be represented (Figure 2).
— Block diagrams, giving a general view of the sets and their respective orientations,
— Symbols on geological maps, indicating average strike values and the dip direction, and value for different types of discontinuity (joints, faults, foliation, etc.).