Schmidt hammer test

This schmidt hammer test is used to obtain an approximate estimation of the uniaxial compressive strength of rocks. Its main application is for intact pieces of rock, but it can also be used on discontinuities.
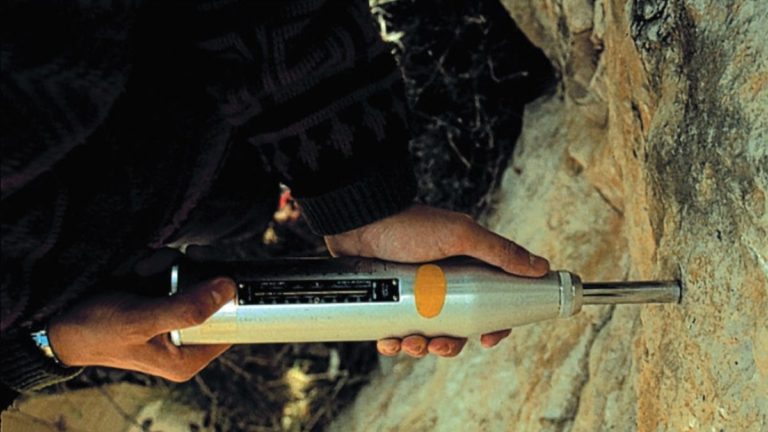
The L-type sclerometer consists of a cylindrical metal device containing a spring that drives a rod (and its hammer) out of the cylinder. When the hammer strikes the rock surface its rebound is measured. The surface to be tested should be free of cracks and fissures and must be cleaned before testing by removing the patina of weathered rock. Pressure is then applied to the hammer until the spring is released. The instrument must be placed perpendicular to the test plane. The spring rebound value depends on the hardness or strength of the rock. This value is indicated on a scale on the side of the apparatus. At each measuring point, there should be 10 hammer blows, provided they do not damage the surface; the 5 lowest values are then discarded and the average value is taken of the rest.
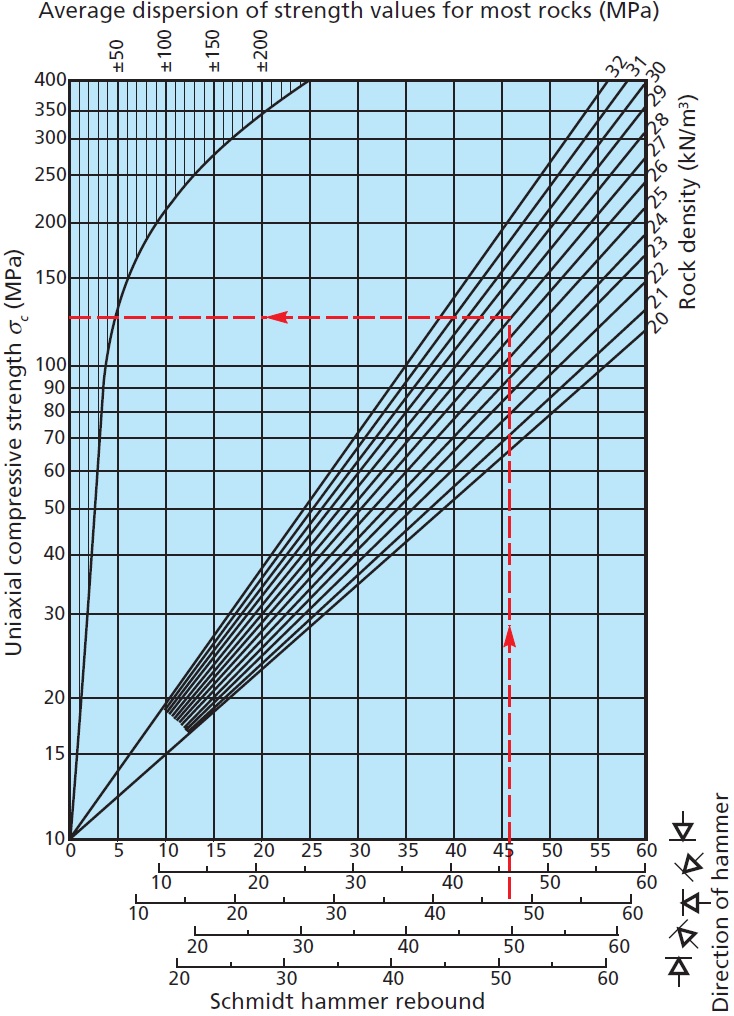
The resulting rebound values are correlated with a chart with the uniaxial compressive strength, which depends on the unit weight of the rock and the inclination of the hammer and test plane. In continuation shows an example of its application. Uniaxial compressive strength laboratory tests results should be available to calibrate measurements with the Schmidt hammer test and to establish correlations.
Uniaxial strength assessed using the Schmidt hammer
Calculate the uniaxial compressive strength expected of a rock with a density of 27 kN/m3 using the Schmidt hammer on specimens of the intact rock.
Hammer rebound values: 49, 46, 45, 45, 44, 50, 48, 46, 43, 44 (the measurements are obtained with the hammer applied perpendicularly to a vertical fresh rock surface).
Method: mean rebound value is calculated from Schmidt tests. For every 10 values, the five lowest are discarded and the mean value is obtained from the remaining five (for 12 values, 6 are discarded). In this case, the values that remain are 46, 46, 48, 49, and 50; the average rebound value is therefore 48.
This mean rebound value is plotted on the x axis of the graph shown below until it reaches the density value of the rock being studied, depending on the direction of the hammer. From this point, a horizontal line is plotted until it intersects the y axis, giving the expected uniaxial compressive strength value of the rock, which in this case is 125 MPa.

